
What does it mean for a technology to be ready?
Is the market ever truly ready for something fundamentally new?
Brilliant technologies either arrive too early - solutions in search of a problem or urgent market needs go unmet because the science isn’t mature enough. This is not a simple communication gap. It’s a systemic challenge, rooted in the very nature of deep tech - long and uncertain R&D cycles, high capital intensity, and profound technological and market uncertainty.
Navigating this foggy frontier requires more than intuition. It demands a better map.
Over the past decades, different organizations have built frameworks to bring clarity to innovation. Each step in this evolution removes a blind spot, yet none has captured the synchrony between technologies that can ship and markets that can pull.
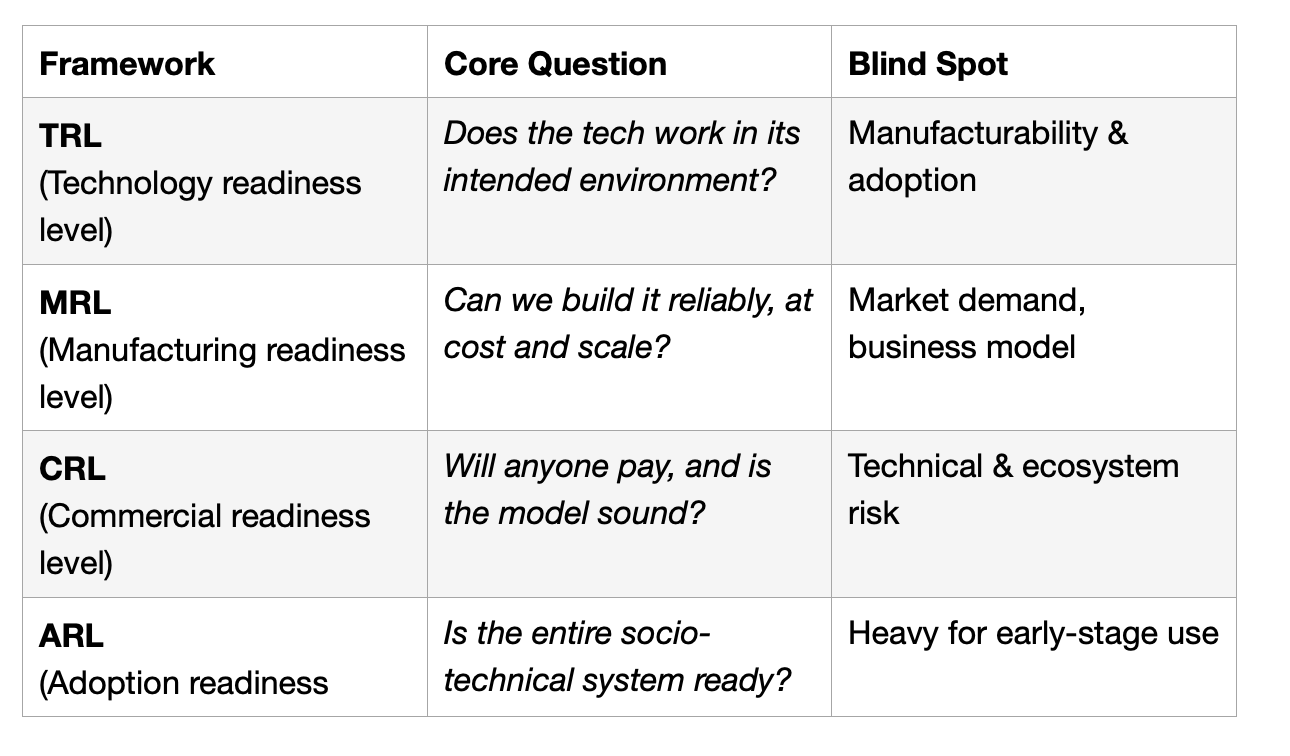
TRL (Technology Readiness Level): The foundation
First sketched by NASA researcher Stan Sadin in 1974 and codified for the Space Shuttle program in 1989, the TRL scale created a common language for engineers and program managers to manage risk. The nine-level system measures maturity from basic principles (TRL 1) to a flight-proven system (TRL 9). The U.S. Department of Defence (DoD) and the European Space Agency (ESA) adopted it for their own R&D and procurement programs.
MRL (Manufacturing Readiness Level): The build-ability check
The DoD soon discovered that a technology could be flight proven (TRL 9) yet impossible to produce affordably or at scale. This led to the creation of MRLs, a parallel 0-10 scale to assess producibility and manufacturing risk. MRLs ask different questions: Can this be made in a real production environment? Are the materials available? Is the process repeatable and high-quality?
CRI (Commercial Readiness Index): The business case
Venture capital needed a tool to answer the ultimate question: Will anyone buy it? The CRI, created by the Australian Renewable Energy Agency (ARENA), serves as a framework for measuring how commercially mature renewable energy technologies and projects are. Its purpose is to help developers and investors judge whether a given solution is ready to compete in the market and attract sustainable financing.
ARL (Adoption Readiness Level): The systemic view
Even with mature tech (high TRL), scalable manufacturing (high MRL), and a sound business case (high CRI), projects often failed. The U.S. DOE developed ARLs to capture systemic, non-technical barriers. Categories include Value Proposition, Market Acceptance, Resource Maturity, and License to Operate.
Now, in Indian deep-tech conversations, TRL is still the dominant language while MRLs, CRIs, and ARLs barely feature. That leaves us flying half-blind.
The instinct, then, is to combine technical and market axes into a neat 2×2 matrix. But to truly capture deep-tech risk, we need to move from single axes to composite dimensions embedded inside. Here’s a straw-man framework of the 2x2 Deep Tech Readiness Matrix fas a start. It maps solution maturity against market readiness.
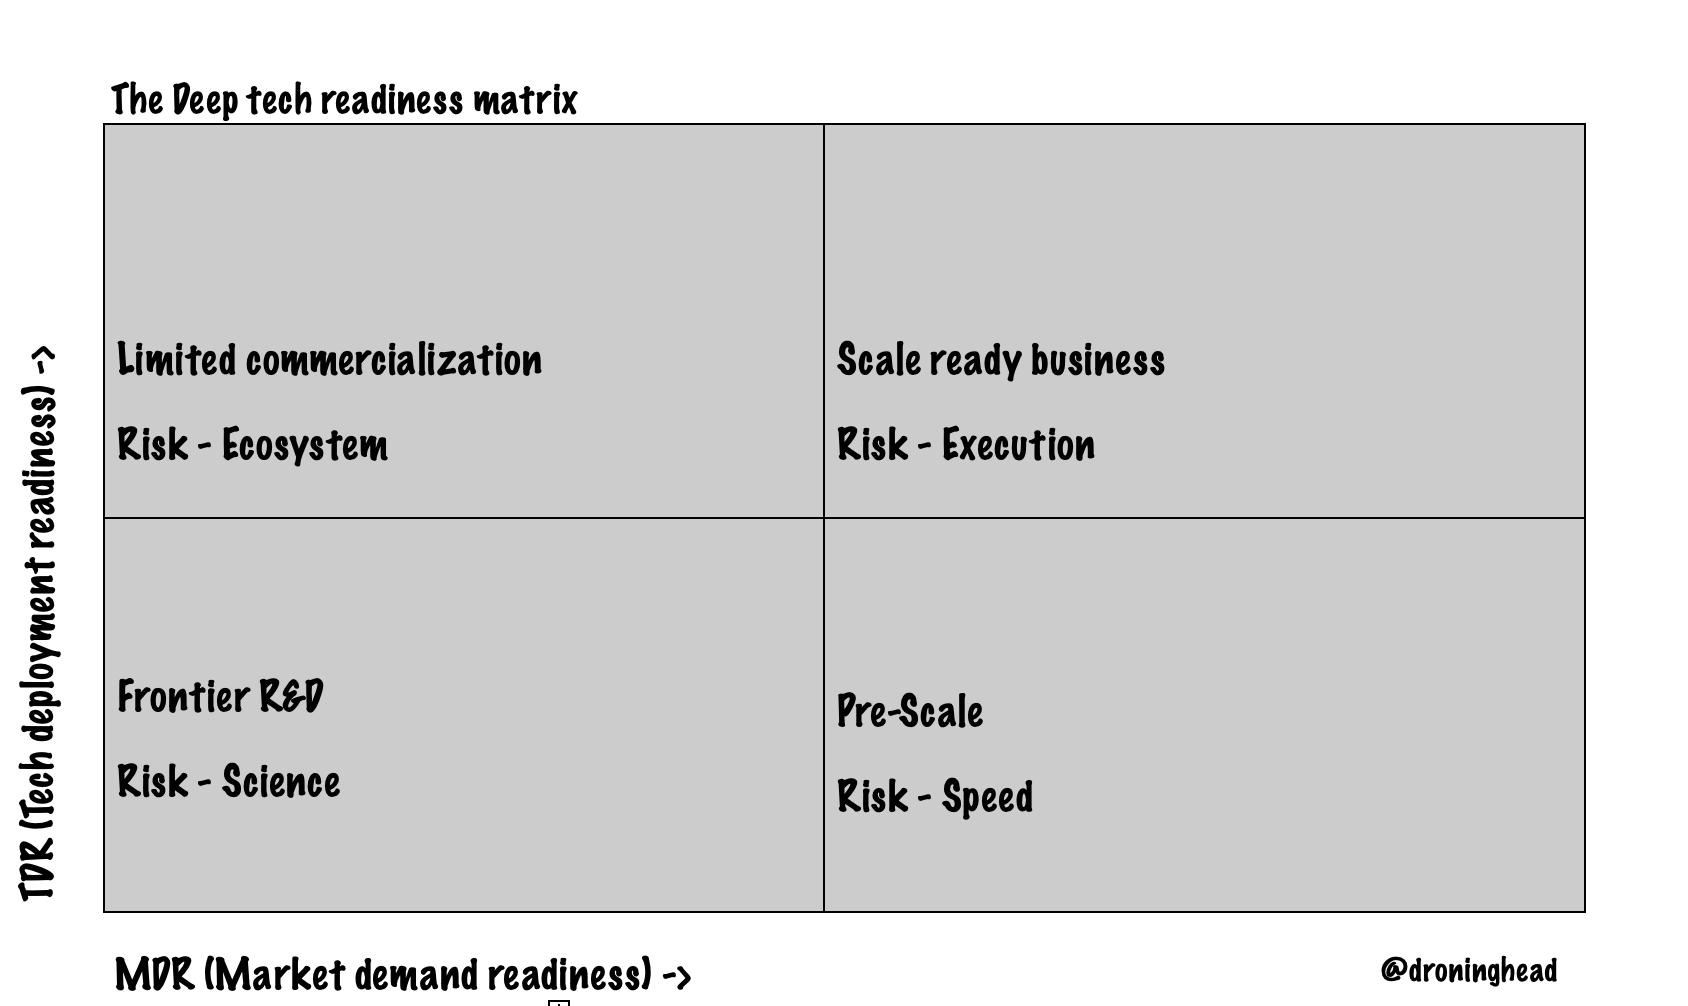
Quadrant 1: Pure R&D. Risk is almost entirely scientific. Endeavours here are funded by grants and university budgets or in some cases, early stage investors. The goal: proof-of-concept.
Quadrant 2: Strong market pull but immature solutions. The race is against time. Market-shaping strategies like securing anchor customers to help evolve the solution whilst paying are critical.
Quadrant 3: The tech works, but ecosystem resists adoption due to high switching costs, regulatory hurdles, or flawed business models leading to commercial irrelevance.
Quadrant 4: The promised land. A mature, producible solution meets a willing and able market. Focus shifts from de-risking to execution and scaling.
Assuming each axis runs 0-10, here are five questions worth asking:
Is TDR ≥ 5 and MDR ≥ 3? (will differ for stage of VC, esp. early)
Does MDR lag TDR by more than three levels?
Could a single regulatory change unlock a leap in MDR?
Who is the anchor customer underwriting TDR → TDR+1?
What non-dilutive capital (if any) could fund the next quadrant move?
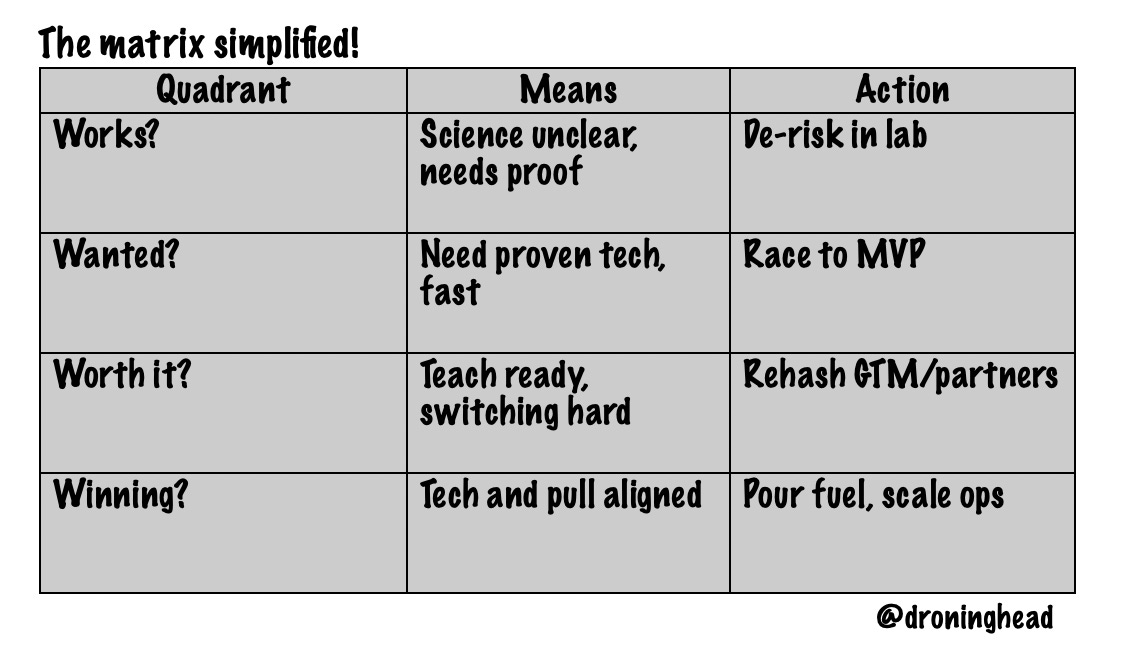
A simplified, pocket-note version, if I may :
This matrix certainly doesn’t capture everything. For instance, event shocks like COVID led to mRNA pole-vaulting from lab to scale in under 12 months. Similarly, cheaper manufacturing often creates demand readiness way faster.
But the exercise matters. A better map means fewer ventures lost in the Valley of Death. I invite folks to help stress-test this model, suggest refinements, and share observations where ventures zig-zagged across the matrix.